Smart Lighting
Smarter lighting. Lower operational effort.
Control individual luminaires and groups, automate dimming, monitor faults and connect lighting operations to real-time events.
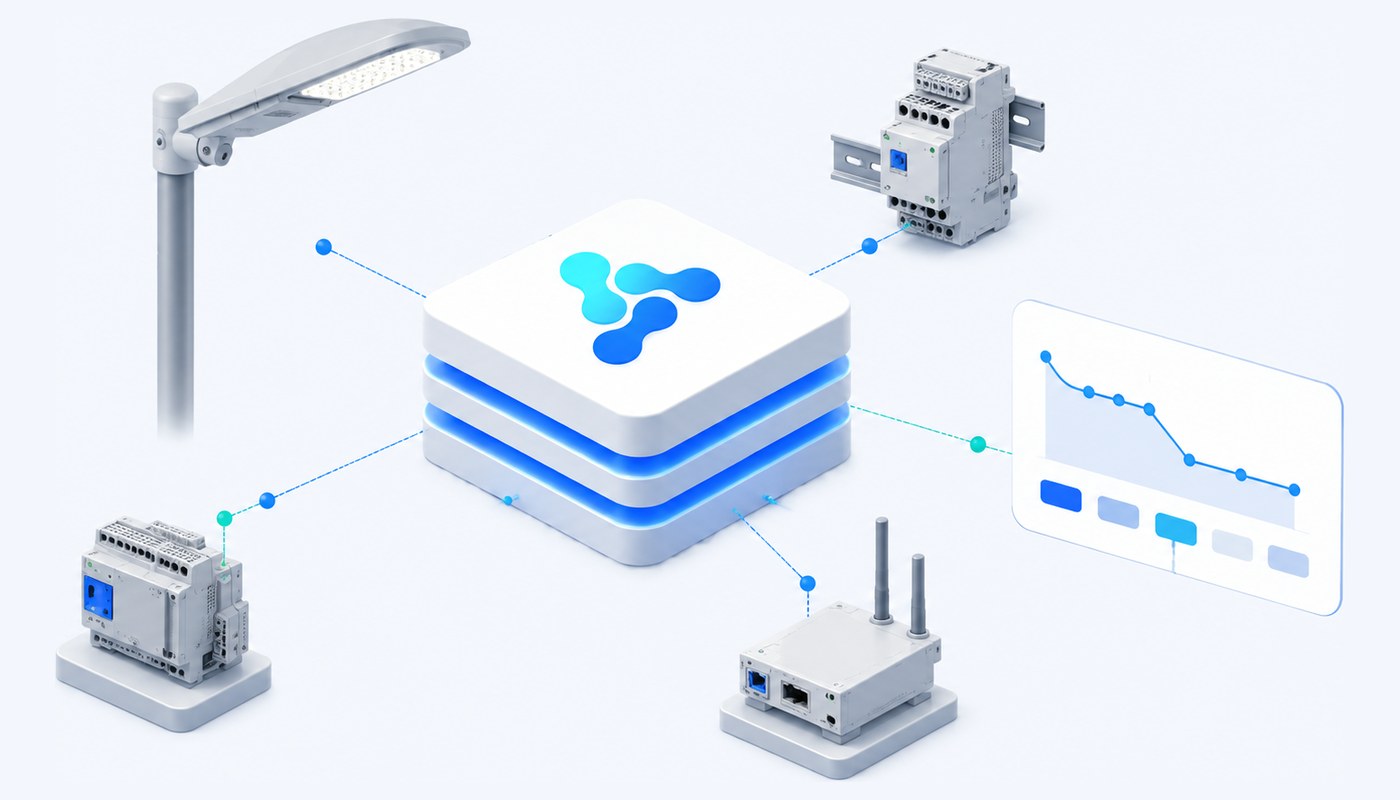
Challenge
Lighting is expensive to run and slow to inspect.
Three problems show up in almost every installation, and none of them is solved by replacing the luminaires alone.
Consumption runs unmeasured
Lighting draws power every night whether the street needs full output or not. Without per-device measurement there is nothing to tune and nothing to prove.
Faults are found by patrol
A luminaire that stops working is usually reported by a resident or spotted by a crew driving past — days after it failed.
Control is split across systems
Different manufacturers, controllers and network technologies each arrive with their own tool, so nobody operates the whole installation from one place.
Architecture
From the luminaire to the operations screen.
The reference architecture for lighting, and what each stage becomes inside the platform.
›
›
›
›
What each stage becomes in the platform
Capabilities
What you can do once the installation is modelled.
Each of these is a documented platform mechanism applied to lighting — not a separate lighting product.
Individual and group control
Send a command to one luminaire, or to a group aggregated for exactly that purpose. Groups also carry their own dashboards and views.
Dimming
Dimming is a command template with the parameters it needs at execution and the response metrics that confirm the level was applied.
Schedules and calendars
Rules can evaluate the current date, time and day, and the platform keeps a configurable calendar of public holidays to schedule against.
Rules on time or sensor input
Conditions on metrics, parameters and time combine with AND/OR. Rules carry priorities and can be enabled or disabled without deleting them.
Fault monitoring
Reported states and metrics make a failing unit visible on the list, the dashboard and the map, without waiting for a report from the street.
Energy metrics
Values reported by the fixture are stored as metrics with timestamps, so consumption can be compared across devices, groups and periods.
Remote configuration
Parameters can be set on the model, the version or the individual instance, so a change of policy does not mean a site visit.
Map and dashboard views
Every device, group and system appears on the interactive map and in dashboards built from a widget palette.
A change history that holds
Practically every entity carries an audit section recording who changed what, with the old and the new value.
Operational scenario
One evening, end to end.
The path a single event takes, from the sensor that reports it to the state an operator can see.
Illustrative example
1
A sensor reports
Presence, ambient light or another input arrives as a metric with a value and a timestamp.
2
A rule evaluates
The condition combines the metric with the current time and any relevant parameter. Priorities decide which rule wins if several match.
3
A command is issued
The rule triggers a dimming command template, which supplies the parameters the device needs at execution.
4
The device executes
The command is queued and sent through the protocol instance for that network.
5
The response is measured
The device reports back. The response metrics defined on the command template are what the platform checks.
6
The command is validated
The command carries a state over time, so an operator can tell the difference between sent, confirmed and failed.
7
The state becomes visible
Dashboards, lists and the map show the result, and the audit trail records what changed.
Nothing above is specific to lighting. The same seven steps describe a valve, a meter or a controller — what changes is the model, the payload and the rule.
What it is built on
The platform capabilities behind this solution.
Nothing here is lighting-specific software. Each capability has its own page.
Digital Twins & Device Lifecycle
Luminaires, controllers and telecontrol units as models, versions and instances, from onboarding to retirement.
Data, Metrics & Commands
Metric templates that decode reported values, and command templates that carry dimming and switching back to the device.
Rules & Automation
Conditions on metrics, parameters and time, with priorities and operational enable or disable.
Connectivity & Integration
LoRaWAN and the other field protocols, each as a configurable containerised service instance.
Dashboards & Visualization
Operational screens per version and per installation, built from a widget palette.
GIS & Spatial Operations
Poles, groups and systems on the interactive map, with filters and map profiles.
Fit with what you already have
See how Vision can fit your deployment.
Share your current devices, connectivity and operational objectives.