Smart Infrastructure / SCADA
Operate distributed infrastructure from one control layer.
Combine telemetry, device status, control, alarms, automation and GIS in a unified operational environment.
Challenge
Control systems age faster than the assets they run.
Industrial and utility sites usually already have control. What they lack is a layer above it that everyone can use.
Islands of supervision
Each site or subsystem has its own supervision, with its own tags, its own screens and its own idea of what a device is.
History that stops at the site
Trends are often local. Comparing this station with that one, or this year with last, means exporting and reconciling by hand.
Commands without a trail
When an operator acts, the useful question later is who did what, when, and whether the equipment actually confirmed it.
Architecture
An operational layer over the control you already run.
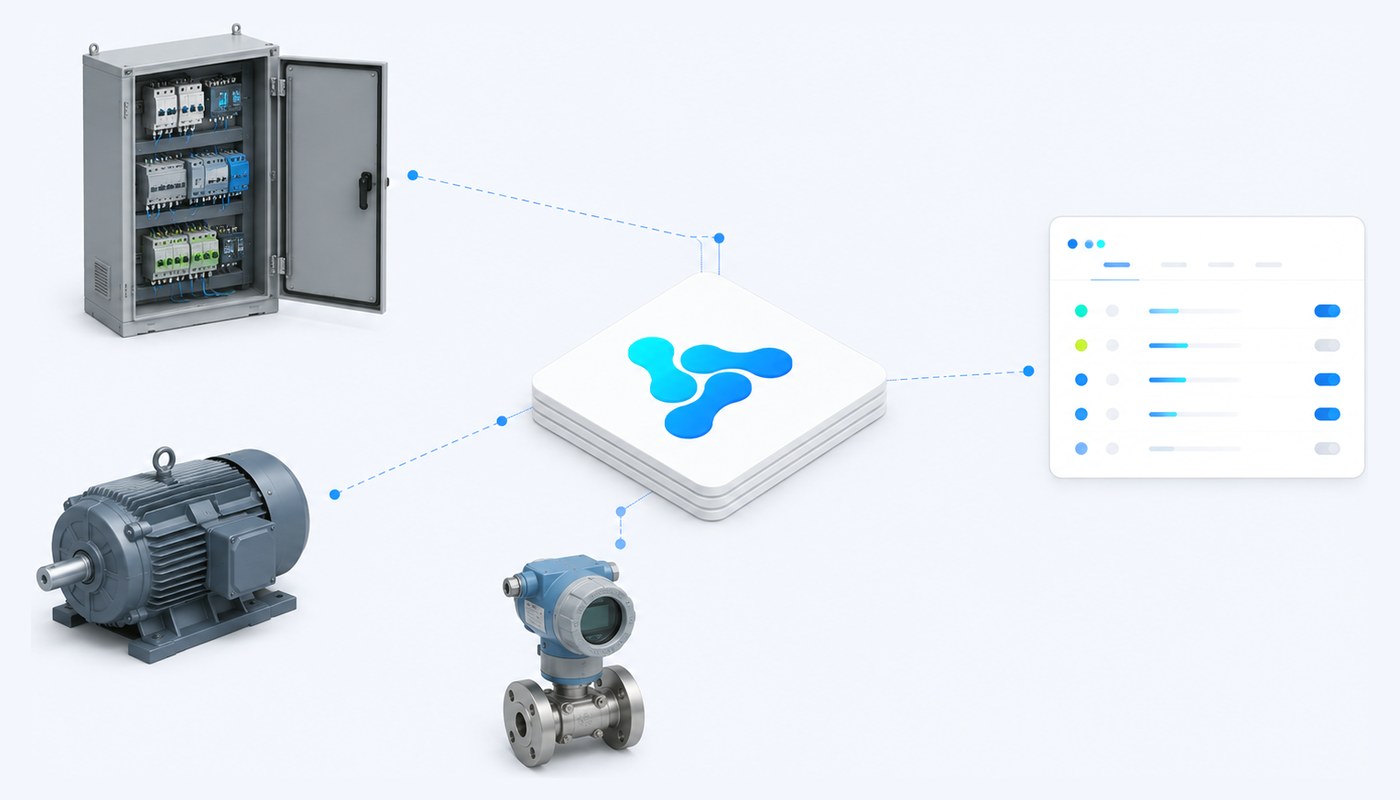
The platform does not replace local control. It models the assets, normalises what they report and gives the estate one place to be operated from. The exact architecture is configured around the devices, protocols and processes of each deployment.
›
›
›
›
What each stage becomes in the platform
Operational scenario
A command that has to be provable.
The value of the operational layer shows up after the action, not during it.
Illustrative example
1
An operator issues a command
The command template supplies the parameters the equipment needs, and the platform records who issued it.
2
The command is queued
It travels through the protocol instance for that network, with its own state rather than a fire-and-forget message.
3
The equipment responds
The device reports back, and the response metrics named on the template are what gets checked.
4
The command is validated
Sent, confirmed and failed are distinguishable states, so an operator is not guessing.
5
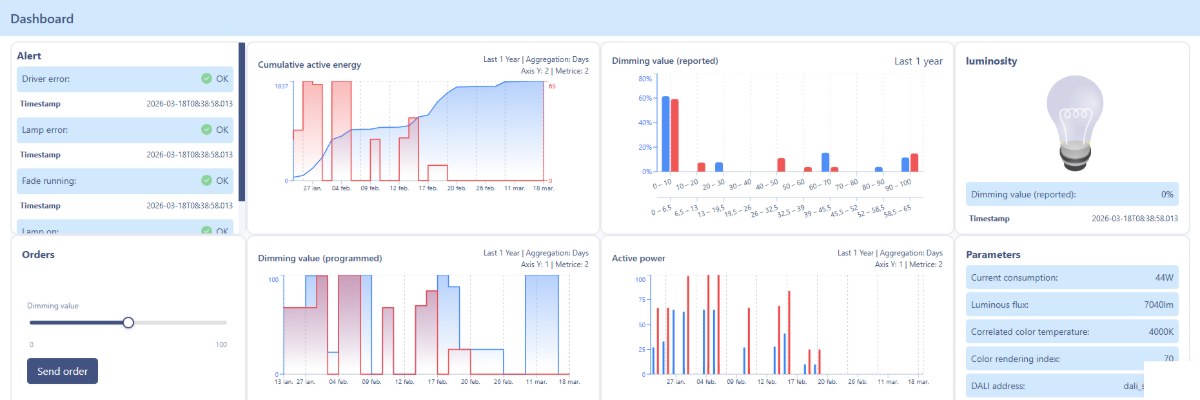
The dashboard reflects it
The new state appears on the screens and, where relevant, on the map.
6
The trail survives
The audit section keeps the action with its old and new values, available long after the shift ends.
This example is illustrative. Which commands exist, who may issue them and what confirms them are configured per deployment.
Operational scenario
Outcome
One operational view across heterogeneous infrastructure.
Inside the platform.
What it is built on
The platform capabilities behind this solution.
Use the documented device, data, automation, visualisation and integration capabilities to build a supervisory layer around your existing control systems.
Digital Twins & Device Lifecycle
Controllers, instruments and accessories as models, versions and instances, organised into IoT systems and groups.
Data, Metrics & Commands
Metric templates for telemetry, command templates with response validation and a command state over time.
Rules & Automation
Conditions on metrics, parameters and time, with priorities and operational enable or disable.
Connectivity & Integration
Protocols as containerised service instances, plus CODEC definitions where payloads need decoding.
Dashboards & Visualization
Operational screens per version and per installation, built from a widget palette.
Security & Audit
Identity, roles and permissions, with a change history that records old and new values.
Fit with what you already have
See how Vision can fit your deployment.
Share your current devices, connectivity and operational objectives.