Dashboards & Visualization
See the big picture. Act on what matters.
Build reusable dashboards that turn real-time device data into clear operational views, KPIs, maps, charts and actionable insight.
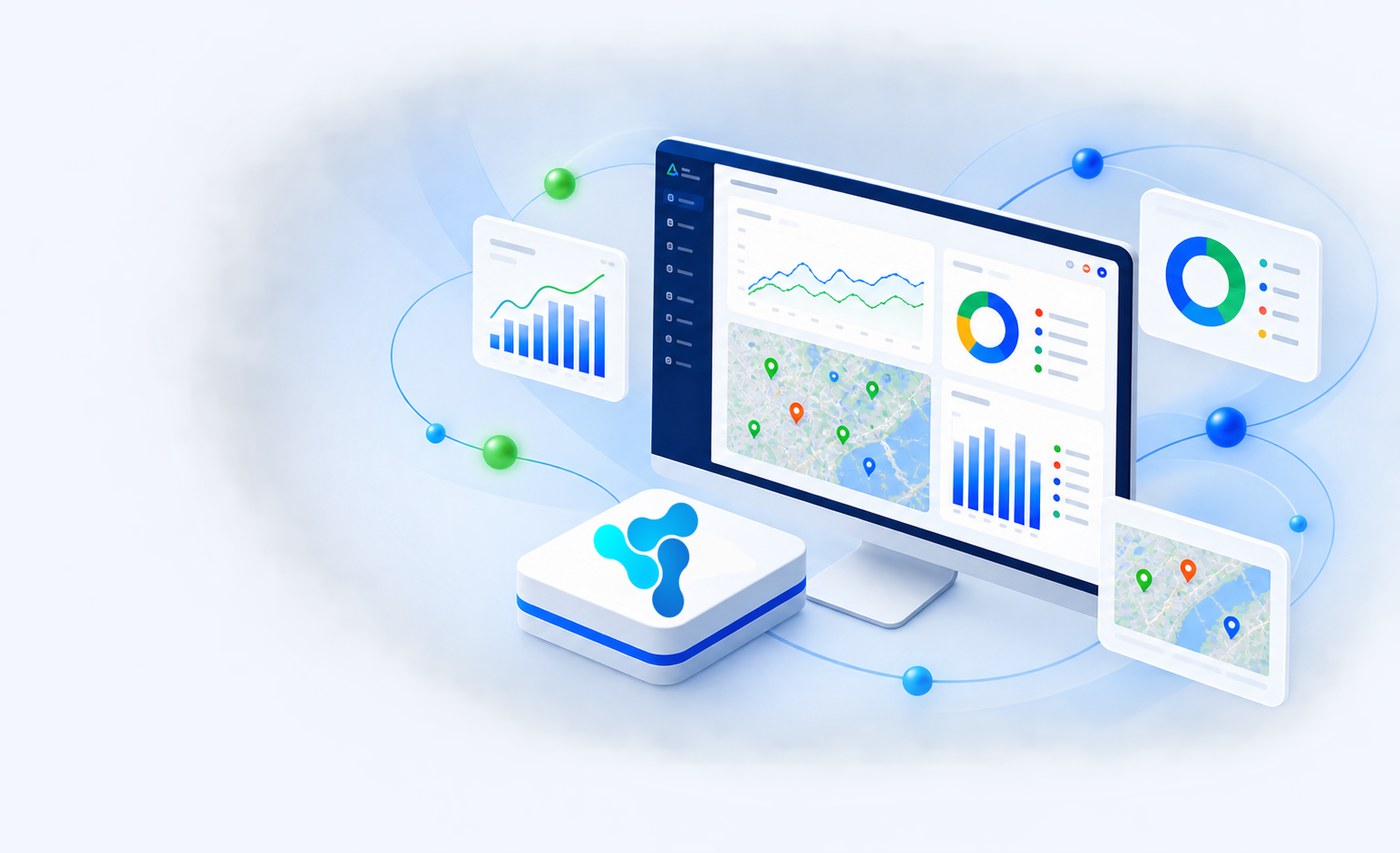
Real-time data
Live updates from devices
Interactive views
Zoom, filter, drill down
Reusable widgets
Build once, reuse everywhere
Multi-source
Metrics, commands, events
Role-ready
Views tailored by user
Everything you need to visualize operations.
From real-time charts to spatial dashboards and operational status views.
Live charts & maps
Visualize metrics, status and location.
Multiple chart types
Line, bar, area, pie, gauge, heatmap.
Smart filters
Filter by device, group, time and state.
Alerts & events
See issues and trends as they happen.
Custom layouts
Arrange and resize widgets freely.
Export & share
Reuse dashboards and export views.
Build dashboards visually.
Add widgets, configure data sources, preview changes and publish without rebuilding the UI.
Drag & resize
Arrange cards freely.
Widget library
Choose from reusable components.
Preview before save
Validate the final view.
Metric binding
Connect widgets to metrics and parameters.
Group dashboards
Aggregate views across device groups.
Visualization widgets
Choose the right visual for each operational question.
Line / Area
Bar / Column
Pie / Donut
Gauge / KPI
Heatmap
Data Table
Geo Map
Status Cards
From data to operational insight
A simple pipeline from devices to dashboards, analysis and action.
1
Devices
Metrics and events
2
Ingestion
Collect and normalize
3
Storage
Time-series data
4
Visualization
Widgets and maps
5
Operational insight
Monitor, analyze, act
Real platform screens
Actual Vision Smart Platform interfaces used for dashboard and widget configuration.
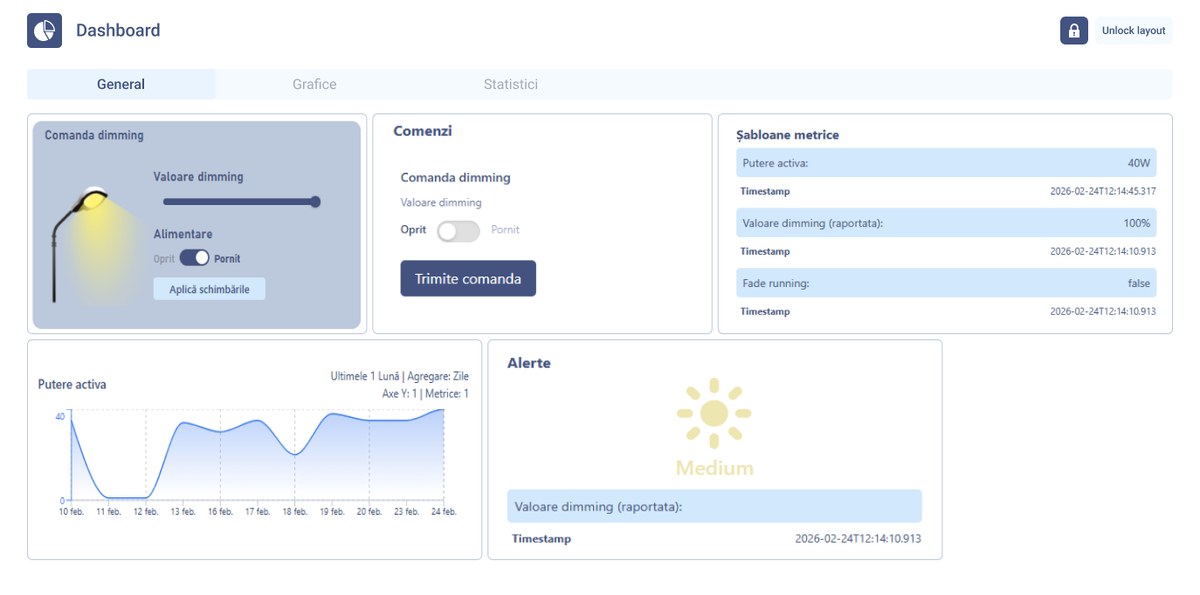
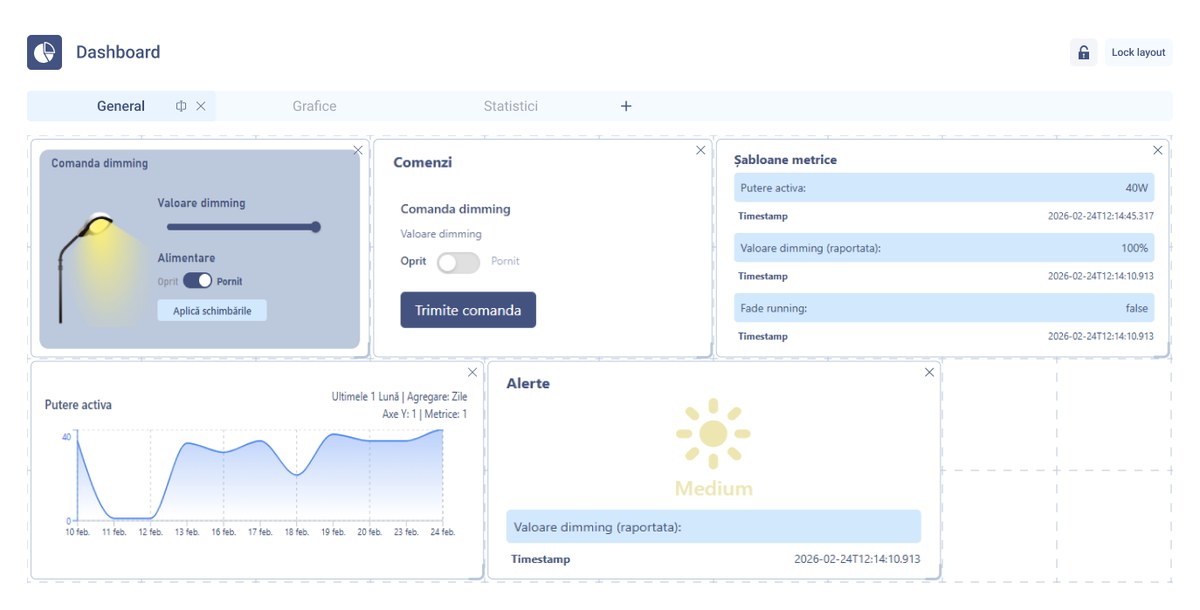
Dashboard overview
Live widgets, commands, metric templates and alerts on a single operational view.
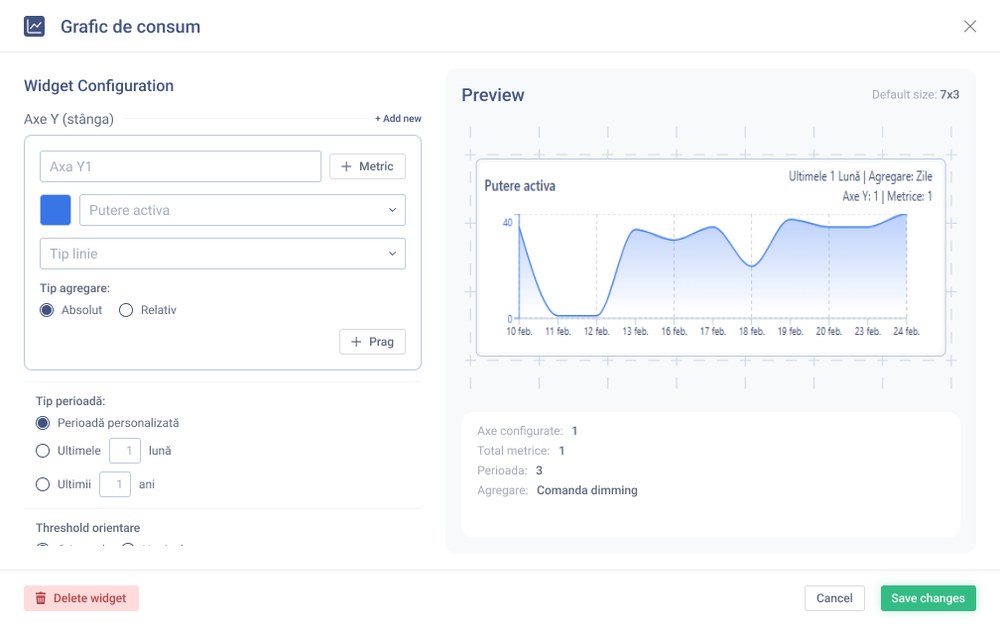
Widget configuration
Bind a widget to metrics, set axes, aggregation and period, and preview the result.
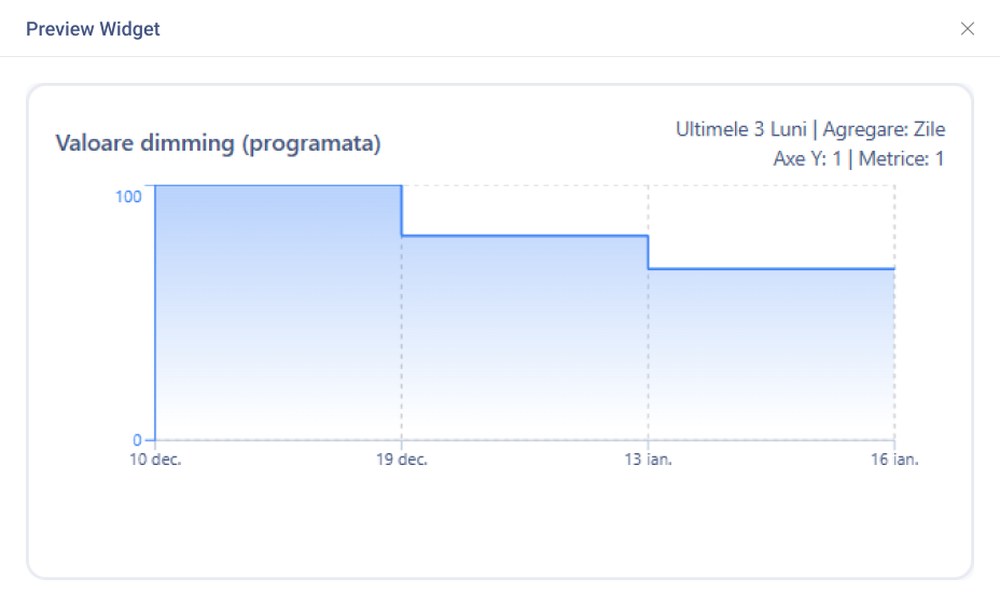
Widget preview
Validate the final view before adding the widget to a dashboard.
Turn your data into decisions.
Build dashboards that give teams the visibility they need, when they need it.