CUSTOMERS
Built for organizations that operate their own infrastructure.
Vision Smart Platform is configured around your equipment, your operational roles and your processes. Once the system is running, the registry, the rules, the dashboards and the data stay yours to change.
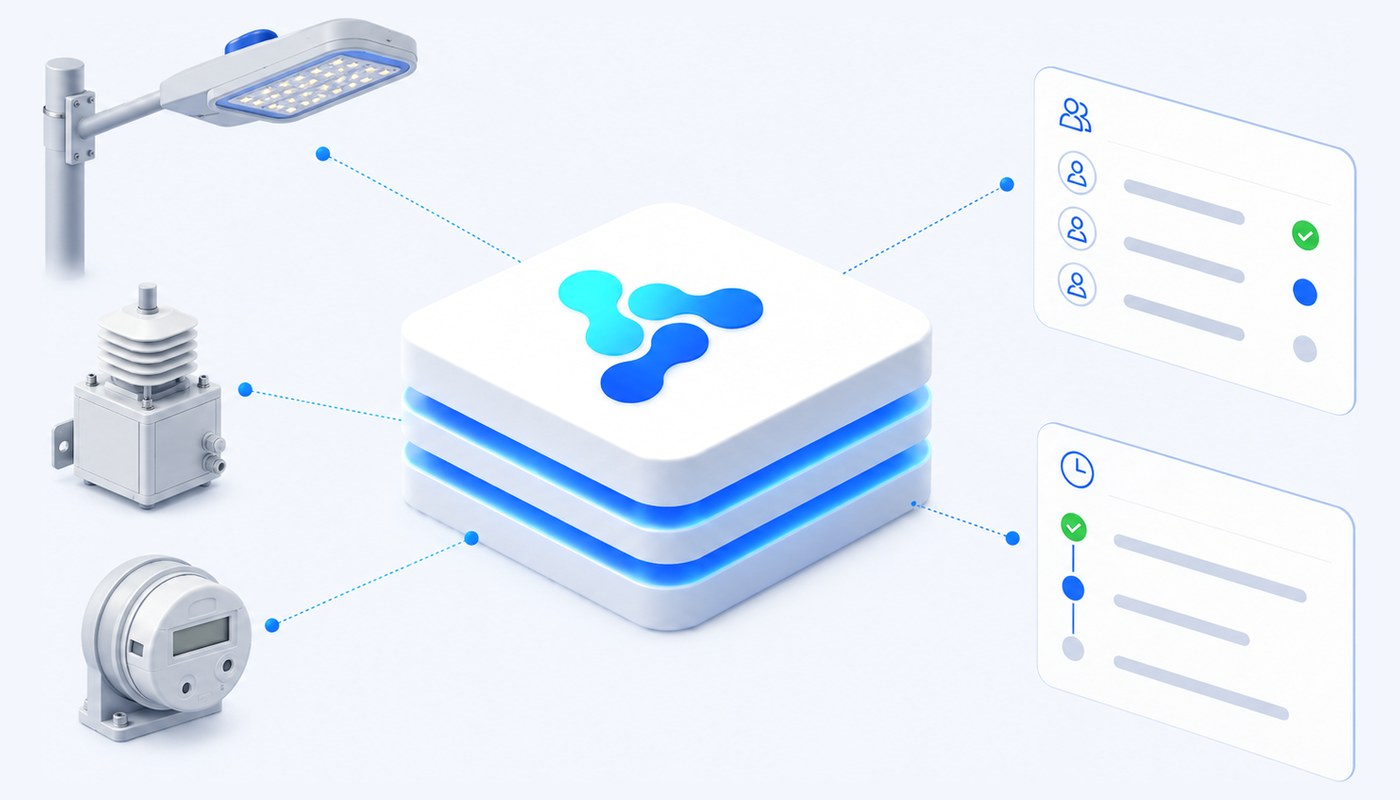
OPERATING MODEL
One installation. Three clear roles.
The commercial relationship is not paperwork kept somewhere else. Company, vendor, integrator and client are objects in the platform registry, and every IoT system is defined against them.
Client
The organisation the system belongs to
The beneficiary of the installation. An IoT system cannot be defined without one, and every device, rule, dashboard and map layer inside it inherits that context.
Integrator
The organisation that builds and maintains it
The company that implements the system and keeps it running. It is a mandatory field on the system as well, so operational responsibility is recorded in the platform rather than assumed.
Vendor
The origin of the equipment
The producer or supplier of a device model and of its versions. Vendor is a mandatory attribute of every equipment version, so each installed device can be traced back to what it is and who made it.
END-TO-END
From field signal to operational action.
The same six steps run under every configuration of the platform. What changes between installations is the equipment, the protocols and the rules — not the path the data takes.
01
Field equipment reports
Sensors, meters, luminaires and other simple devices produce readings and states where the infrastructure actually is.
02
Controllers and gateways carry it
Controllers and gateways move field traffic towards central operations and hold local control between the equipment and the platform.
03
A protocol instance receives it
Each protocol or complex integration runs as its own configurable, containerised service instance — MQTT, HTTP, ChirpStack and LoRaWAN among them.
04
Payloads are decoded and mapped
Metric templates extract values from JSON or XML payloads, apply an optional preprocessing function and attach a data type and a unit of measure.
05
Metrics are persisted
What is stored is a comparable metric: value, timestamp, device and the template it came from — not a raw message that only one integration understands.
06
Rules, dashboards and maps act on it
Rules evaluate metrics and states and issue validated commands back to the field, while dashboards, widgets and the interactive map show what is happening.
DOCUMENTED SCENARIOS
Three scenarios described in the platform documentation.
These are the configurations the documentation describes in detail, with their equipment and their operating logic. Everything else on this site is a capability of the platform, framed for a domain — not a claim about an existing installation.
Documented use case
Smart lighting
LED luminaires, DALI drivers, LoRaWAN telecontrol units, gateways and the datacentre, operated as one system.
- Dimming commands and on/off control through the DALI driver
- Acquisition of consumption parameters and fault states
- Rules driven by schedule or by sensor input
- Local redundancy and monitoring in the telecontrol unit
Documented use case
Environmental monitoring
Temperature, humidity and particulate sensors communicating over LoRa and LoRaWAN, mapped as simple devices with their own metrics.
- Temperature and humidity measurement
- PM2.5 and particulate measurement
- Periodic or condition-driven reporting
- Threshold rules, dashboards and map layers
Documented use case
Differentiated presence sensing
Cameras and computer-vision algorithms detect categories of objects or people and can drive luminaire brightness according to the active scenario.
- Classification of people, cars, bicycles, trucks or buses
- Detection zone or line configured directly on the image
- Detection triggers the matching lighting command
- Scenarios decide which response applies
OWNERSHIP
What stays under your control.
Once the system is deployed, the parts that decide how it behaves are configuration, not code that someone else holds.
The device registry
Models, versions, instances, groups and nomenclators are configured through the interface, not through files edited by hand. What you define stays yours to change.
The access model
Users belong to groups, groups carry roles, roles aggregate permissions — down to the level of a menu, an entity and an action, through the interface and the API alike.
The audit trail
Creation, editing and deletion are recorded centrally with date, time, author and description, across entity changes, general system events and authentication.
The rules
Rules are named, prioritised, owned and given a validity period, and commands are validated before they leave the platform.
The command history
Every command sent to a device is recorded, filterable by name, date range, status and value, and exportable.
The screens
Dashboards are separated by role — management, operator, maintenance, support — and edited by dragging and resizing widgets, with those edits recorded in the audit as well.
DATA LIFECYCLE
Operational data, with a lifecycle you configure.
An installation that reports continuously produces a very large number of records. The platform treats that as a configuration decision at system level, not as something to discover later.
Retention is set on the system
Each IoT system carries its own automatic-deletion policy, expressed in years, months and days, together with the recipients of the archive.
Automatic deletion
A periodicity configured per system, so a pilot and a full installation do not have to share the same policy.
Archive before removal
Data is archived and sent to the configured users before it is deleted.
Immediate cleanup
A date selector and a delete action allow a controlled cleanup up to a chosen point, through the same archiving path.
The system is also the unit of visibility
The IoT system is the operational context devices live in: it aggregates the inventory, the reported commands and its own dashboard.
Inventory in one place
Accessories, controllers, simple devices, communication devices and groups, each on its own tab of the system record.
Reported commands
Every command sent to the devices of the system, with filters on name, date range, status and value, and with export.
A dashboard per system
Its own editable dashboard, using the same widget palette as the rest of the platform — consumption charts, command widgets, luminaire widgets and alerts.
NEXT STEP
Bring us your operating model.
The fastest way to find out whether the platform fits is to describe what you already run. Four things are usually enough to give you a straight answer.