Smart Environment
Turn environmental data into operational awareness.
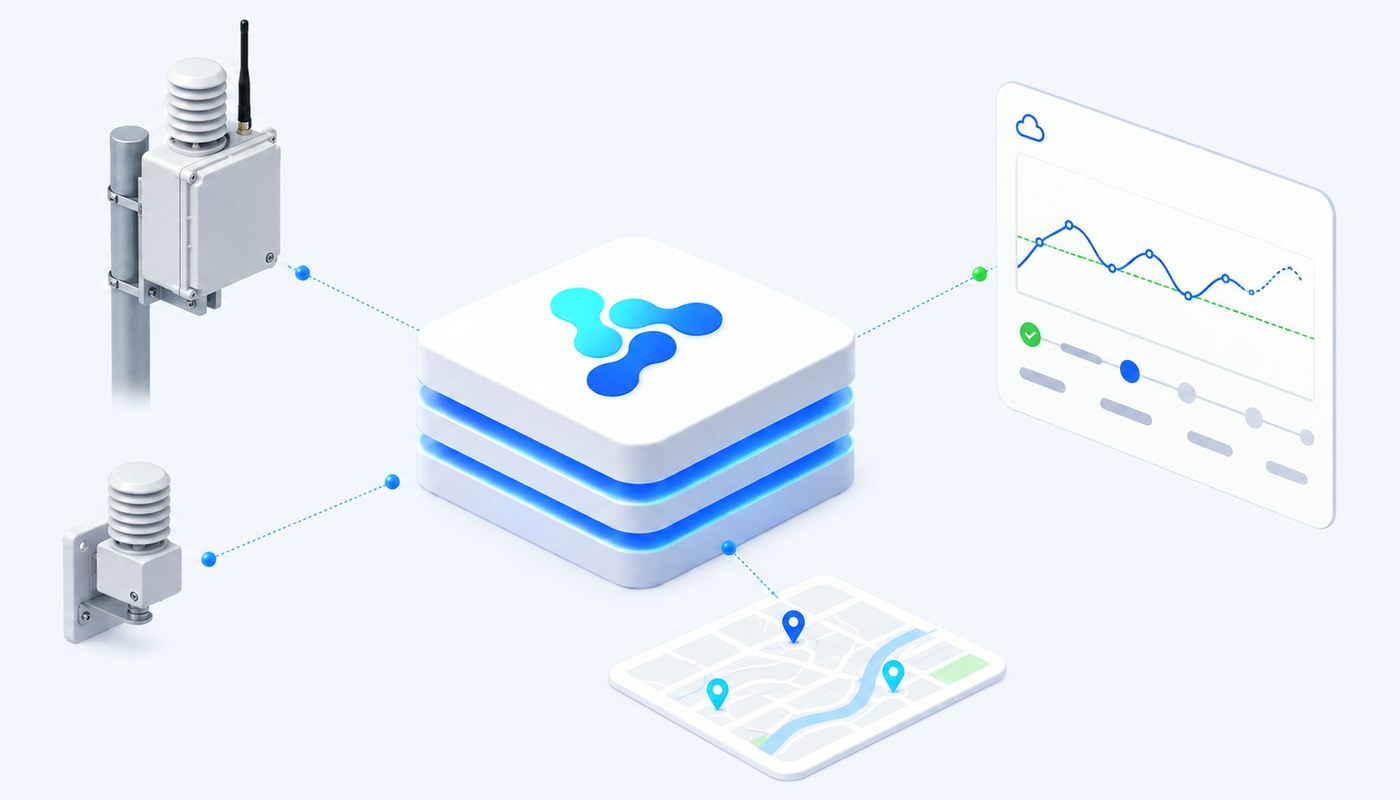
Collect sensor data, visualize conditions, trigger alerts and understand environmental status in geographic context.
Challenge
Environmental data is easy to collect and hard to use.
The sensors are rarely the problem. What breaks is everything between the reading and the decision.
Readings live in separate tools
Each sensor family arrives with its own portal and its own units, so comparing two locations means exporting from two systems and reconciling them by hand.
Thresholds nobody is watching
Data that is only visible when someone opens a dashboard is data that acts too late. A threshold has to be able to trigger something by itself.
A number without a place
A reading that is not tied to a located asset tells you that something happened, not where to send anyone.
Architecture
From the sensor to a comparable number.
Environmental sensors are modelled as simple devices carrying their own metrics.
›
›
›
›
What each stage becomes in the platform
Capabilities
What you can do with a modelled sensor network.
Each item is a documented platform mechanism, applied to environmental monitoring.
Temperature and humidity
Reported as metrics with their own units of measure, comparable across suppliers and locations.
Particulates and dust
PM2.5 and similar indicators are handled the same way — as metrics extracted from the payload by a template.
Periodic or conditional reporting
A device can report on a schedule, or only when something changes. Both arrive through the same pipeline.
Threshold rules
A rule compares a metric against a value, optionally combined with time or other conditions, and acts when the threshold is crossed.
Notifications and actions
A rule effect can be a notification, a command to a device or group, or a change to a parameter.
Dashboards
Widgets built for the version or the installation show current values and history side by side.
Geographic distribution
Every sensor appears on the interactive map, with filters and map profiles for different operational views.
Groups and systems
Sensors can be aggregated into groups and belong to an IoT system, which carries its own dashboard and retention policy.
A record of what changed
Configuration changes are recorded in the audit section with the old and the new value.
Operational scenario
A threshold crossed at three in the morning.
What happens between the reading and the response, when nobody is looking at a screen.
Illustrative example
1
The sensor reports
A particulate reading arrives and is stored as a metric with its value, its unit and a timestamp.
2
The rule evaluates
A condition compares the metric against the configured threshold, combined with the time of day if that matters.
3
The effect fires
The rule sends a notification, and can also issue a command to a device or group in the same step.
4
The state is visible
The reading and the alert appear on the dashboard and on the map, on the device that produced them.
5
The history stays
Metrics keep their timestamps, so the episode can be reviewed later rather than reconstructed from memory.
6
The change is recorded
If someone adjusts the threshold afterwards, the audit section keeps the old value next to the new one.
The threshold is configuration, not code. Adjusting it, disabling it for a period, or giving it a different priority are all operational actions — no release required.
What it is built on
The platform capabilities behind this solution.
No environment-specific product. The same mechanisms, pointed at a different kind of device.
Digital Twins & Device Lifecycle
Sensors as models, versions and instances, with parameters inherited and overridable per unit.
Data, Metrics & Commands
Metric templates that turn raw payloads into comparable, timestamped values.
Rules & Automation
Threshold conditions combined with time and other metrics, with priorities and enable or disable.
Connectivity & Integration
LoRaWAN and the other field protocols, each as its own configurable service instance.
GIS & Spatial Operations
Sensors, groups and systems on the interactive map, with filters and map profiles.
Enterprise Administration
Units of measure, data types and the other nomenclators that keep readings comparable.
Fit with what you already have
See how Vision can fit your deployment.
Share your current devices, connectivity and operational objectives.